
Journal Impact Factors
- JCR - Journal Impact Factors - Compare journals using citation data.
- CiteScore Metrics from Scopus - Measure the yearly average number of citations to recent articles published in a journal.
- InCites - Analyze institutional productivity
Your Research Impact and Performance
Altmetrics
Altmetrics measure the impact of scholarly content. It is based on how far and wide it travels through the social Web (e.g. Twitter), social bookmarking (e.g. CiteULike), news, and collaboration tools (e.g. Mendeley). They offer alternative metrics to the more traditional ones, such as the Impact factor and H-Index.
Tools to increase your visibility
- ORCID
- DaYta Ya Rona (figshare)
- Google Scholar Citations Profile
- Social Media
- Share your research with a broader audience on social media platforms so it can be viewed, shared, liked, downloaded, and discussed.
- If a publisher's policy does not allow sharing a full-text article, you can still provide a summary and link it to the original publication.
- Create an account on the most frequently used social media platforms: LinkedIn, Academia.edu, ResearchGate, SlideShare, Twitter, Blogs, Facebook, etc.
Tools to track your online research activity
- Altmetric Explorer
- Altmetrics in Scopus
- OurResearch
- Altmetric Bookmarklet for Researchers
- Altmetric Badges for Individual Researchers
Bibliometrics
Bibliometric analysis use data on numbers and authors of scientific publications and on articles and the citations therein (and in patents) to measure the “output” of individuals/research teams, institutions, and countries, to identify national and international networks, and to map the development of new (multi-disciplinary) fields of science and technology.
H-index
The index is based on the distribution of citations from a researcher's publications. Jorge E. Hirsch developed the h-index as a process for quantifying the output of an individual researcher. Hirsch writes: “I propose the index h, defined as the number of papers with citation number ≤ h, as a useful index to calculate a researcher's scientific output”.
How to calculate your h-index?
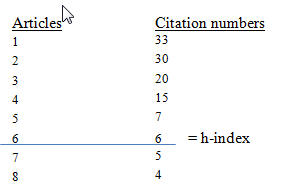
To manually calculate your h-index, organise articles in descending order based on the times they have been cited. For example, an author has eight papers that have been cited 33, 30, 20, 15, 7, 6, 5, and 4 times. This tells us that the author's h-index is 6. An h-index of 6 means that this author has published at least six papers that have each received at least six citations.
More context
- The first paper has been cited 33 times and gives us a 1 (there is one paper that has been cited at least once).
- The second paper has been cited 30 times and gives us a 2 (two papers have been cited at least twice).
- The third paper gives us a three and all the way up to 6 with the sixth-highest paper.
- The final two papers have no effect in this case, as they have been cited less than six times.
(Shannon Gordon, Univ of Waterloo library)
Citation Tools
Support
If you need assistance with increasing your research visibility, creating a researcher profile or understanding the impact of your research, contact our Research and Open Scholarship Librarians.